Time series analysis by James D Hamilton - its considered to be the bible on time series analysis, pretty much covers all the theory , it doesnt have any code or pseudocode
Introduction to Time Series with R by Metcalfe & Coweperwait
Analysis of Financial Time Series by Tsay
Aim and Motivation
Would be exploring time series analysis in the context of finance
Implementing code from the book by Tsay , would be using the book by Hamilton and Metcalfe as reference
Aim to understand different time series models in R.
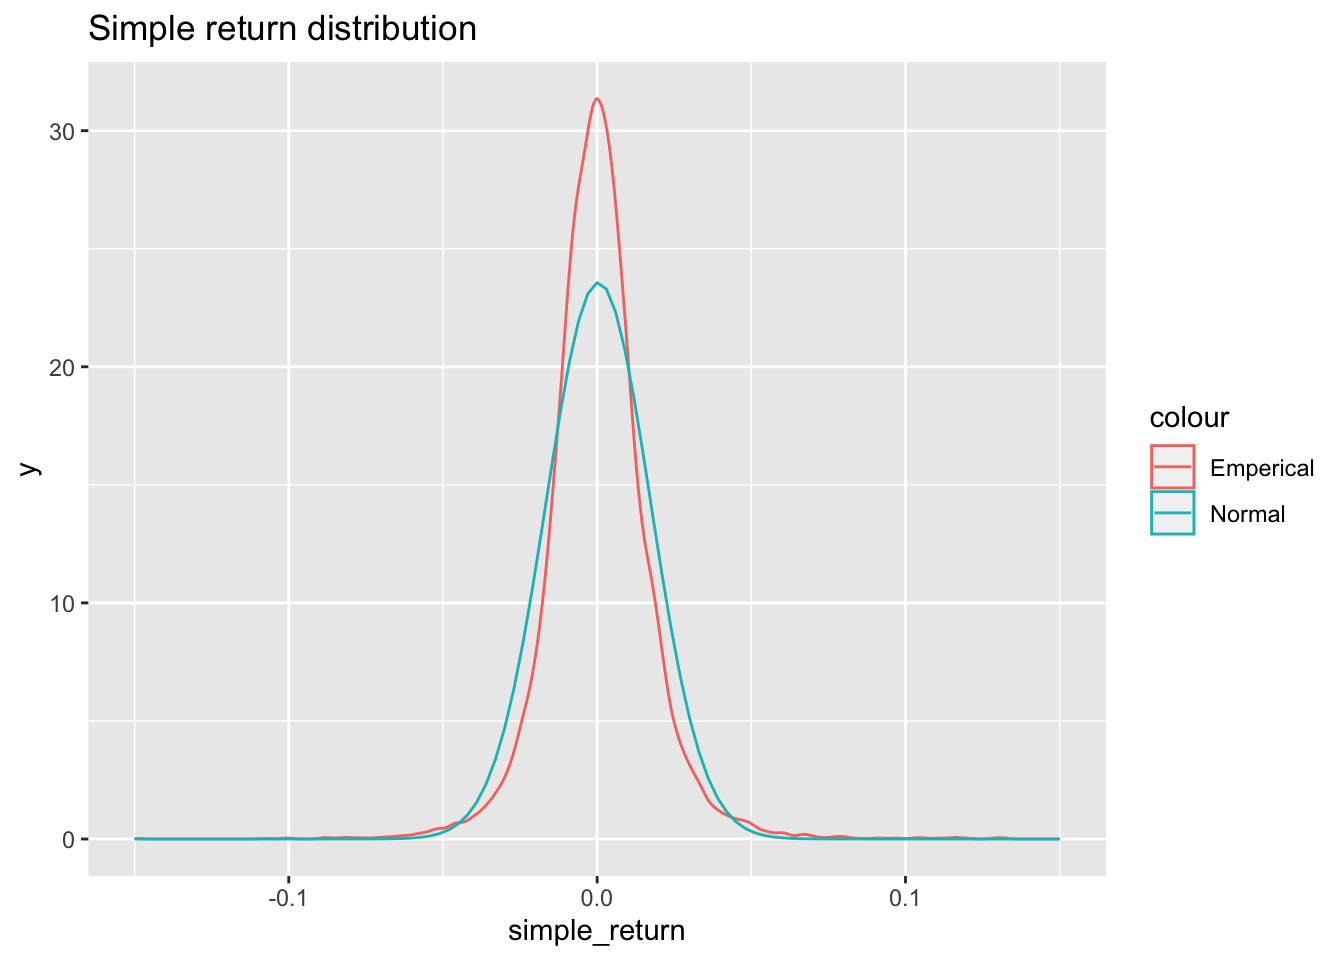
P_t = P_{t-1}(1+R_t) \implies R_t = \frac{P_t - P_{t-1}}{P_t} where P_t and R_t are the price and return at time t respectively Continuously compounded return or log return
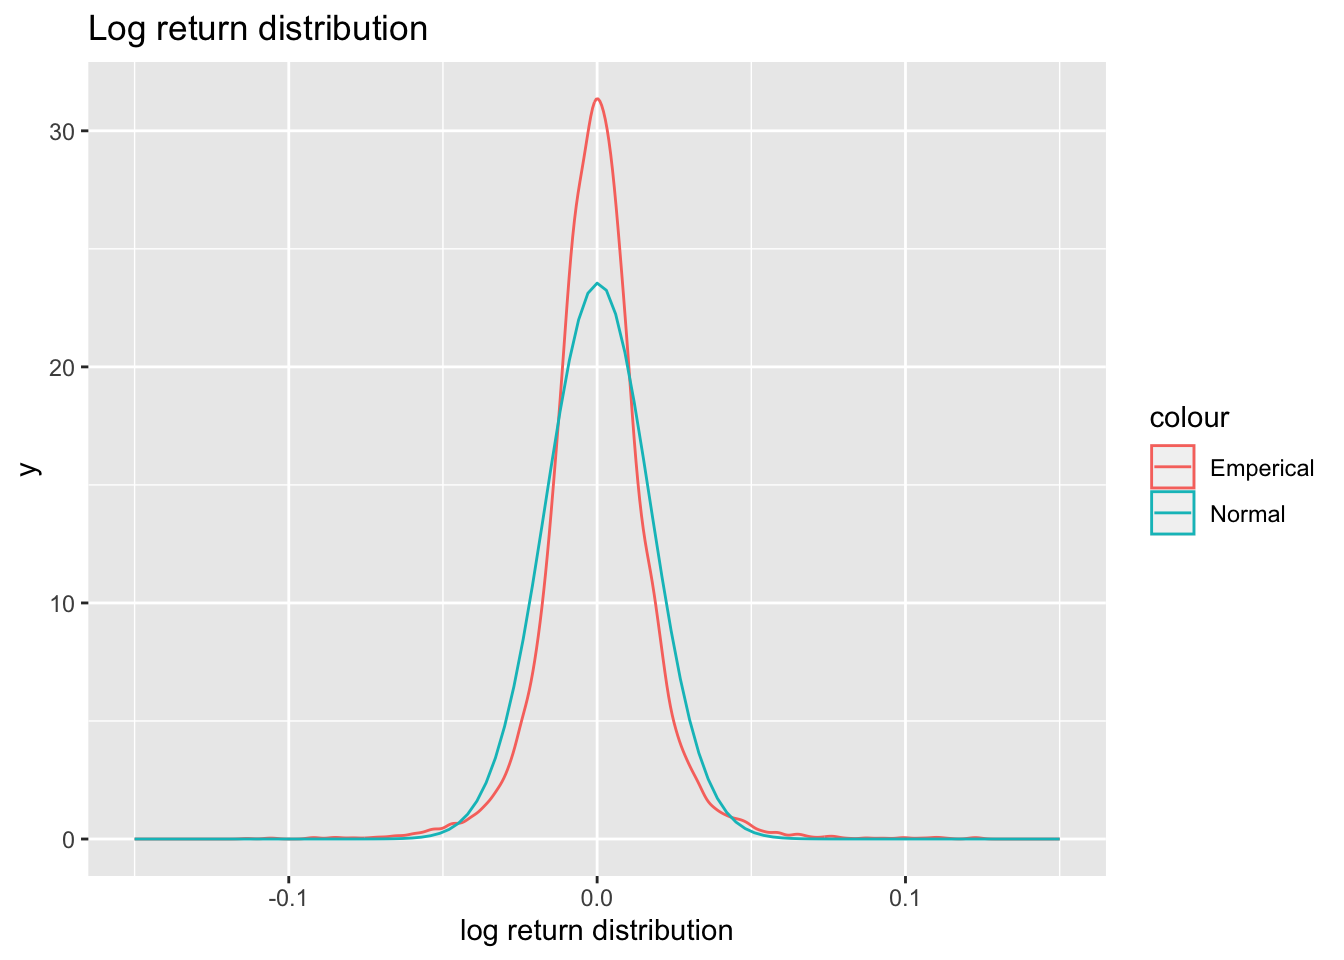
r_t = \ln(1+R_t) Dividend Payment
r_t = \ln(P_t + D_t) -\ln(P_{t-1}) Where D_t is dividend payment between time t-1 and time t .
Definition 2 (Multiperiod gross return) Similiary we can define multiperiod simple return by R_t[k] = exp{[\frac{1}{k}\sum_{j=0}^{k-1}(1+R_{t-j})]} -1 where exp is the exponentential function and k is total number periods the asset was held for.
Log return would be r_t[k] = r_t +r_{t-1}+.....+r_{t-k+1}
Where p is the portfolio , i the ith asset and w_i the weight of the i^{th} asset in the portfolio
* Load data and header =T give the 1st row of the data file , that is the names of the cloumns of the data set
# da contains the return for 5 five stocks and indexes namely IBM ,value-weighted , equal-weighted and S&P composite index from 1970 to 2008library(fBasics)da =read.table("TST/d-ibm3dx7008.txt",header = T) dim(da) # dimensions for the data
[1] 9845 5
da[1:5,]# first five rows
tail(da)#Last 5 rows
ibm = da[,2] # IBM simple returnssibm = ibm*100#Percentage simple returns b =basicStats(sibm)s1 =skewness(sibm)t = s1/sqrt(6/9845) #definition for test statistic here 9845 is N pv =2*(1-pnorm(t)) # Calculate p-valuecat("skewness =", s1,"\nTest Satistic = ",t,"\np-value = ", pv)
skewness = 0.06139878
Test Satistic =  2.487093
p-value =  0.01287919
#IBM = ibm[, 2] # IBM simple return values#IBM = ts(IBM,frequency = 250 ,start = c(1970,1))#plot.ts(IBM)#acf(IBM,lag=250,ylim= c(-0.05,0.05))#ACF is covered in detail down below , the x axis label is fraction of unit time #libm = ibm[,2]*100#length(libm)#mean(libm)#t.test(libm)#k1 = kurtosis(libm)#s1 =skewness(libm)#t3 = (s1^2)/(6/9845)#t2 = ((k1)^2)/(24/9845)#3t2#a = t2+t3#a#normalTest(libm,method = 'jb')
Linear Time Series
Stationarity
Foundation of time series analysis is Stationarity. A time series \{r_t\} is said to be strictly stationary if the joint distribution of (r_{t_{1}},r_{t_{2}},r_{t_{3}},....,r_{t_{k}}) is identical to that of (r_{t_{1+t}},r_{t_{2+t}},r_{t_{3+t}},....,r_{t_{k+t}}) for all t , where k is an arbitrary positive integer and (t_1,t_2,t_3,....,t_k) is collection of k positive integers. Strict stationarity is very hard to verify emperically A time series is said to be weakly stationary if the mean of r_t and the covariance between r_t and r_{t-l} are time invariant where l is an arbitrary integer. Weak stationarity enables us to make inference concerning future observations
\mathbb{E}(t_t) = \mu
Cov(r_t,r_{t-l}) = \gamma_l
Weak stationarity is commonly studied and more practical.
The covariance \gamma_l = Cov(r_t,r_{t-l}) is called the lag-l autocovariance of r_t. From the above defintion it follows that
\gamma_0=Var(r_t)
\gamma_{-l} = \gamma_l
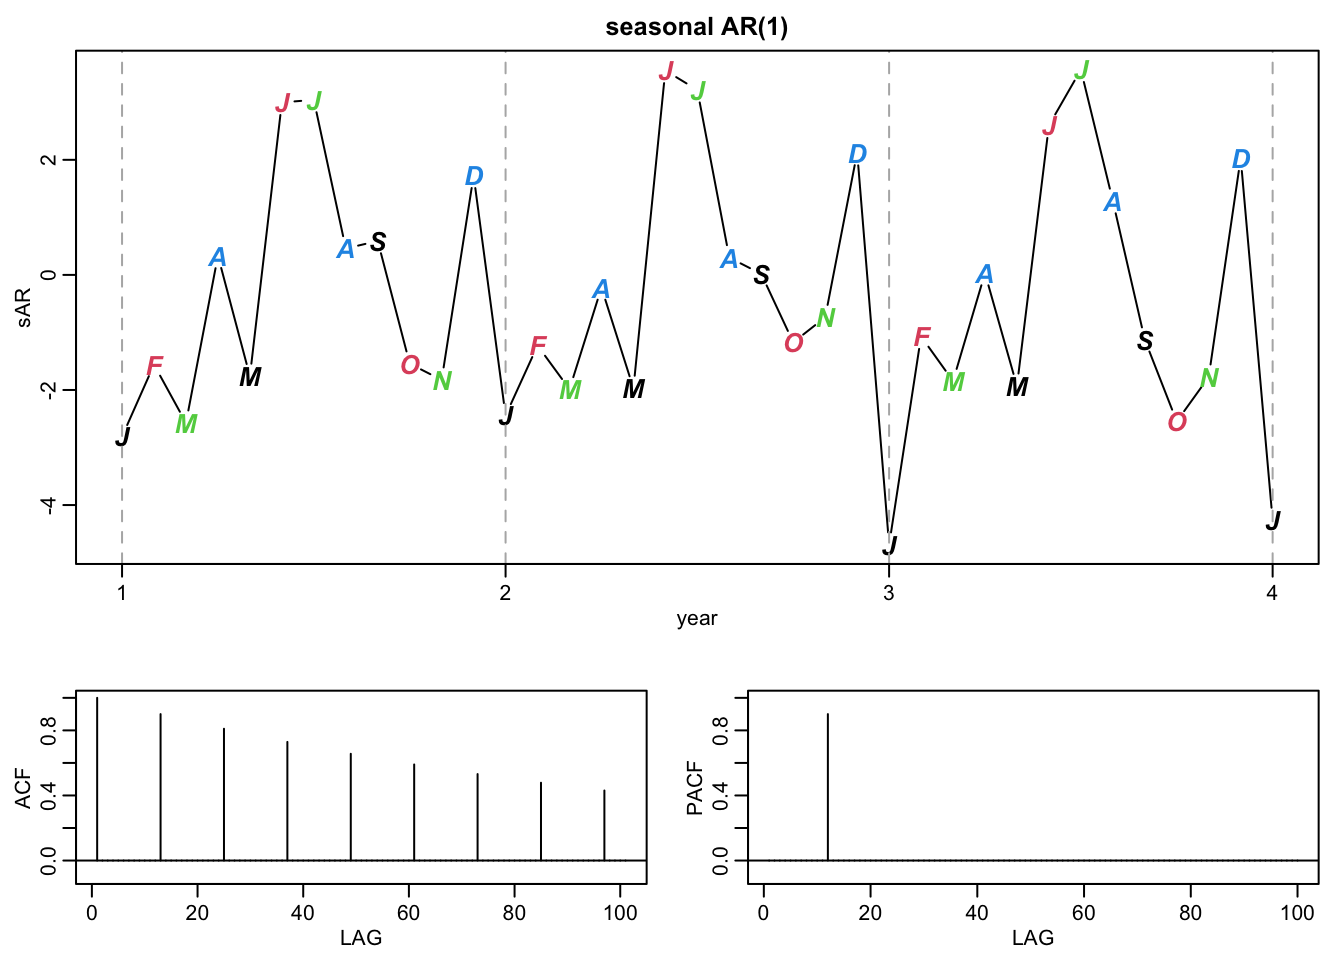
Autocorrelation Function
Consider a weakly stationary return series r_t. When the linear dependence between r_t and its past values r_{t-l} is of interest , the concept of correlation is generalised to autocorrelation. The correlation coefficient between r_t and r_{t-l} is called the lag-l autocorrelation of r_t and is commonly denoted by \rho_l , which under the weak stationarity assumption is a function of l only. Its defined by \rho_l = \frac{Cov(r_t,r_{t-l})}{\sqrt{Var(r_t)Var(r_{t-l})}} = \frac{Cov(r_t,r_{t-l})}{Var(r_t)} = \frac{\gamma_l}{\gamma_0}
Its easy to see that
\rho_0 = 1
\rho_l = \rho_{-l}
-1\leq \rho_l \leq 1
For a given sample of returns \{r_t\}_{t=1}^T , let \bar r be the sample mean. Then the lag-1 autocorrelation of r_t is \hat\rho_1 = \frac{\sum_{t=2}^T(r_t - \bar r)(r_{t-1} - \bar r)}{\sum_{t=2}^T(r_t - \bar r )^2}
The conditions under which \hat\rho is a consistent estimator of \rho_1 are as follows :
The returns \{r_t\} is an independent and identically distributed sequence
\mathbb{E}(r_t^2) < \infty
Then \hat\rho_1 is asymptotically normal with mean zero and variance 1/T
Testing
Let H_0 : \rho_1 = 0 be the null hypothesis versus H_a : \rho_1 \neq 0 the alternative hypothesis. The test statistic is the usual t ratio (check the statistics section for further description) , which is \sqrt{T}\hat\rho_1 and follows asymptotically the standard normal distribution. The null hypothesis H_0 is rejected if the t ratio is large in magnitude or equivalently , the p value of the t ratio is small , lets say less than 0.05